
Subscription Dashboard Metrics
On this page, you'll find a comprehensive reference to the metrics that FastSpring tracks and surfaces in your store's subscription overview dashboard.
The definitions that follow explain the methodology and formulas that FastSpring uses in its subscription metric calculations, alongside example scenarios and charts that show the metrics in context.
Activations
Activations refers to the number of subscriptions activated on a specific date.
Methodology
- Activations are integers. Each integer is either
0or a positive number. - Each purchased subscription corresponds to a unique activation.
- Reactivated subscriptions are included.
- Trial subscriptions are included.
- Deactivated subscriptions aren't included
Example
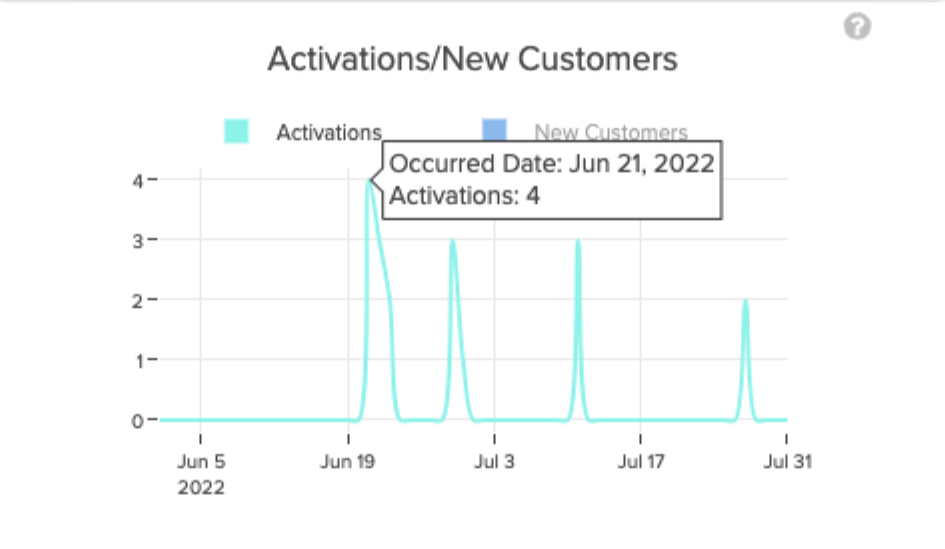
The example chart shows the following events:
- On June 21st, four customers each purchased a unique subscription, resulting in four activated subscriptions.
- On June 27th, a single customer purchased three different subscription products during the same checkout order, resulting in three activated subscriptions.
- On July 12th, another customer purchased a subscription, specifying a quantity of
3, resulting in three activated subscriptions. - On July 27th, two customers each reactivated a subscription within the reactivation period, resulting in two subscriptions activated.
Active Customers
Active customers is a cumulative metric that counts unique customers with at least one active subscription at that point in time.
Methodology
- Active customers are integers. Each integer is either
0or a positive number. - A customer is a person that purchased a subscription, identified by their email address.
- FastSpring counts a customer as active when they purchase at least one subscription.
- FastSpring counts customers with trial subscriptions as active customers if the subscription gets converted to at least one active subscription. FastSpring counts the new active customer on the day they purchased the trial subscription. For example, if a trial subscription starts on March 1st and gets converted on March 3rd, that customer is considered as an active customer as of March 1st.
- If a customer pauses their only subscription, FastSpring no longer considers them active (unless they resume the subscription).
Example
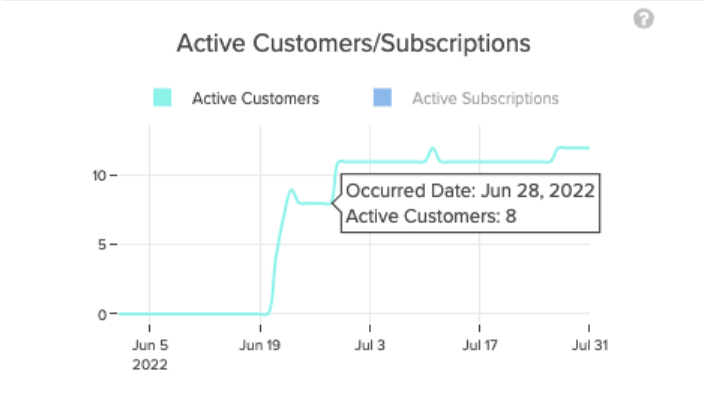
The example chart shows the following events:
- Increases in the chart indicate that a customer purchased at least one subscription.
- Decreases in the chart indicate that a customer deactivated all of their subscriptions.
- On June 21st, four customers purchased one subscription each, resulting in four new active customers.
- On July 11th, one customer purchased three subscriptions, resulting in one new active customer.
- On July 12th, one customer deactivated all their subscriptions, decreasing the metric by one.
- On July 27th, one customer purchased a two-day trial subscription that converted to a standard subscription on July 29th. As a result, there was a new active customer as of July 27th.
Active Subscriptions
Active subscriptions is a cumulative metric that counts unique, active subscriptions.
Methodology
- Active subscriptions are integers. Each integer is either
0or a positive number. - Each purchased subscription counts as an active subscription.
- If an active subscription gets deactivated, FastSpring no longer considers it active.
- If a customer pauses their subscription, FastSpring no longer considers it active (unless the customer resumes the subscription).
- FastSpring considers trial subscriptions active if the subscription gets converted to an active subscription. FastSpring counts the new active subscription on the day the customer purchased the trial subscription. For example, if a trial subscription starts on March 1st, and gets converted on March 3rd, that subscription is considered active as of March 1st.
Example
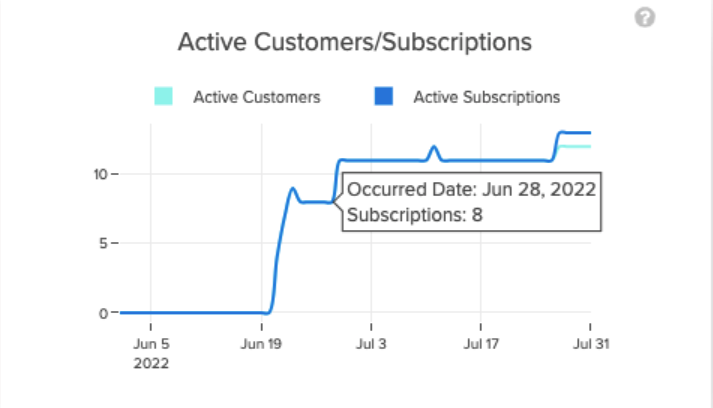
The example chart shows the following events:
- Active Subscriptions is a cumulative metric, so constant lines represent no changes in the current active subscriptions (June 1st - June 19th in this example).
- Increases indicate that a customer purchased a subscription. Decreases indicate that at least one subscription was deactivated.
- On June 21st, four customers purchased one subscription each, resulting in four new active subscriptions.
- On July 11th, one customer purchased three subscriptions and another customer deactivated two subscriptions, resulting in one active subscription being added to the metric.
- On July 12th, one customer deactivated one subscription, decreasing active subscriptions by one.
- On July 27th, one customer started two different two-day trial subscriptions, which then both converted to normal subscriptions on July 29th. This resulted in two new active subscriptions being added to the metric on July 27th.
Annual Recurring Revenue
Annual recurring revenue (ARR) represents the total projected revenue from subscriptions on an annual basis.
Methodology
FastSpring uses the following formula to calculate ARR:
ARR = MRR*12
For example, if MRR on March 14th is equal to $100, then ARR on March 14th would be $1200 ($100*12).
FastSpring’s ARR calculation also factors in the following:
- ARR is always
0or a positive number. - FastSpring rounds ARR to two decimal places.
- Because ARR is an annualization of MRR, all events impacting MRR get factored into ARR.
Example
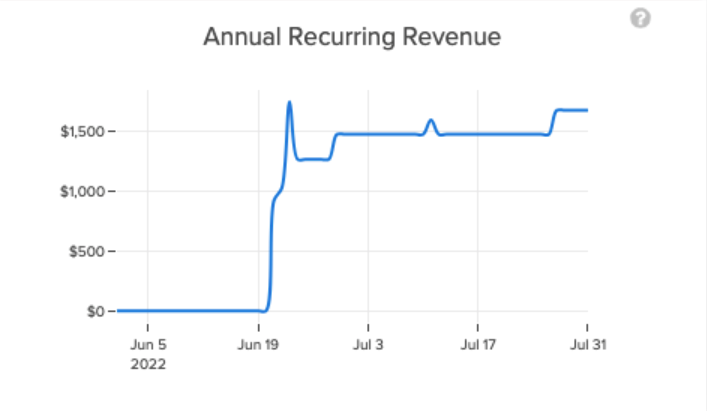
The example chart shows the following events:
- Because ARR is directly proportional to MRR, increases in the chart indicate MRR expansion, and decreases indicate MRR contraction.
- Constant lines represent no changes in the MRR (here, between June 1st and June 20th)
- On July 27th, activations or expansions caused an MRR increase of $16.67, leading to an ARR increase of $200.4 (
$16.67*12), as shown in the chart.
See Monthly Recurring Revenue for more details.
Average MRR per Customer
Average MRR per customer represents the average contribution to Monthly Recurring Revenue (MRR) from each customer during a specific time frame.
Methodology
FastSpring uses the following formula to calculate Average MRR:
Average MRR = MRR / Active Customers
Average MRR is calculated daily. For example, if the following were true on May 3rd:
- MRR = $1000
- Active Customers = 20
Then the value of Average MRR on May 3rd will be $50 ($1000/20).
FastSpring’s Average MRR per customer calculation also factors in the following:
- Average MRR is always a positive number.
- FastSpring rounds Average MRR per customer to two decimal places.
Example
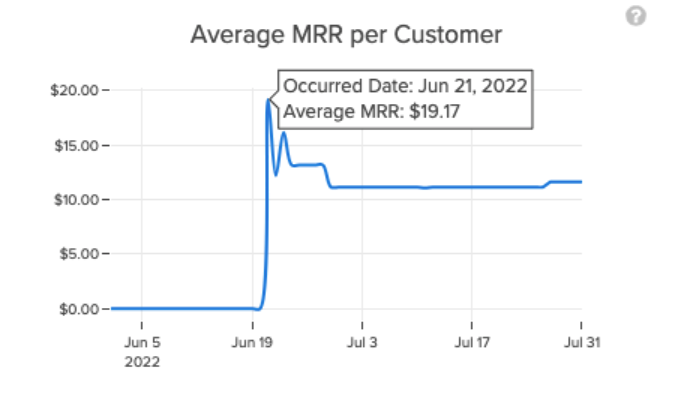
- If the Average MRR per Customer graph remains constant, it indicates no changes in the MRR / Active Customers ratio (for example, between June 1st and June 20th in the chart).
- Increases and decreases in Average MRR per Customer indicate changes in the MRR / Active Customers ratio.
Customer Churn Rate
Customer churn rate indicates the percentage of subscribers who deactivated all their subscriptions within a 30-day period, relative to total active customers at the beginning of the calculation period.
Methodology
FastSpring uses the following formula to calculate customer churn rate:
Customer churn rate (percentage) = 100 * (Total subscriber losses over the past 30 days, excluding the current date) / (Total number of active customers 30 days ago)
For example, assume that there are 500 active customers on April 21st and that a total of 30 subscribers were lost between April 21st and May 20th. The value of Customer Churn Rate on May 21st would be will be 6% (100 * 30 / 500).
FastSpring’s customer churn rate also factors in the following:
- Customer churn is a percentage that can be
0or a positive number. - Customer churn is not cumulative. FastSpring calculates it using a 30-day date range, excluding the current date.
Example
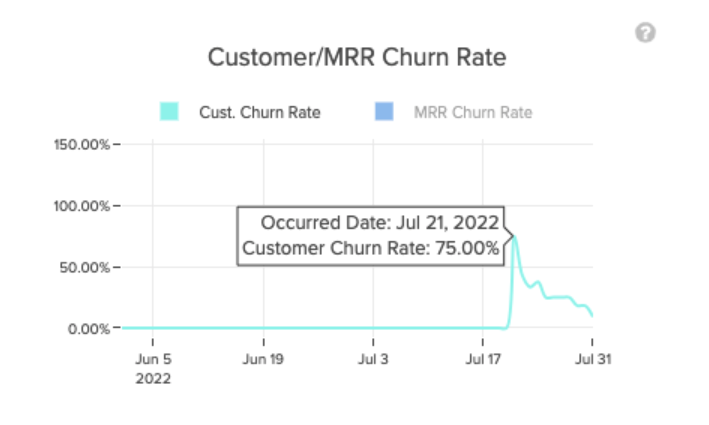
The example chart shows the following:
- On July 21st, the Customer Churn Rate was 75%, which means that over the previous 30 days, the seller lost 75% of the subscribers that were active on June 20th.
- From June 1st to July 20th, Customer Churn Rate is 0%, which means that over the previous 30 days there were no subscriber losses.
Current Active Trials
Current active trials counts each unique, active trial subscription as of the current date.
Methodology
FastSpring includes three trial types in this metric:
- Free trial, without payment; subscription trials that don’t require a payment method.
- Free trial, with payment; subscriptions that require a payment method. Payment gets triggered if the subscription is converted after the trial period has ended.
- Paid trial; subscriptions that require a payment method. Payment gets triggered at checkout.
Lifetime Value
Lifetime value (LTV) represents an estimate of the average revenue that a customer generates throughout their lifespan as a customer.
Methodology
FastSpring uses the following formula to calculate LTV:
LTV = Average MRR Per Customer / Customer Churn Rate
For example, if on July 29th the value of Average MRR Per Customer is $11.60, and Customer Churn Rate is 18.18%, then the value of LTV on that day (July 29th) would be $63.80 ($11.60 / 18.18%).
FastSpring’s LTV rate also factors in the following:
- LTV is always
0or a positive number. - FastSpring rounds LTV to two decimal places.
- LTV is not cumulative. FastSpring calculates LTV daily.
Example
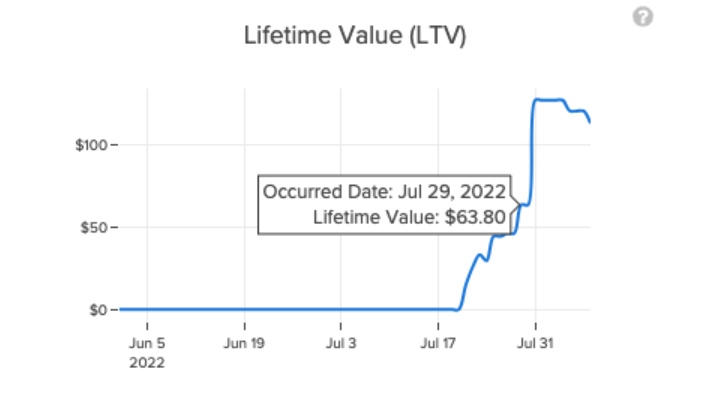
- In the example chart, LTV increasing (here, between July 21st and August 3rd) or decreasing (after August 4th) indicates changes in the
Average MRR Per Customer / Customer Churn Rateratio.
Monthly Recurring Revenue
Monthly Recurring Revenue (MRR) represents the monthly revenue projection (excluding taxes) generated by Active Subscriptions.
Methodology
MRR is calculated daily. For a given day, the MRR value equals the sum of the projected monthly revenue from all of the subscriptions that are active as of that day.
For example, assume that as of March 14th, there are three active subscriptions:
- a monthly subscription for $50/month
- a monthly subscription for $100/month
- a monthly subscription for $150/month
The value of MRR on that day would be $300 ($50 + $100 + $150).
Not all subscriptions are charged monthly, so revenue from subscriptions that are charged weekly or annually get added to the MRR by calculating their equivalent monthly revenue (that is, by multiplying the weekly amounts by four, and by dividing the yearly amounts by 12).
For example, assume that as of April 3rd, there are three active subscriptions:
- a monthly subscription for $50/month
- a weekly subscription for $15/week
- an annual subscription for $240/year
The MRR on that day would be $130:
$50 + ($15 x 4) + ($240 / 12) = $130
FastSpring’s MRR calculation also factors in the following:
- MRR is always a positive number or
0. - FastSpring rounds MRR to two decimal places.
- Deactivated subscriptions don't contribute to MRR. MRR on a given date is calculated by considering only the subscriptions that are active as of that day.
- Cancelled subscriptions contribute to MRR until they become deactivated.
- Add-ons are included in the MRR calculation. An active subscription for $10/month with an add-on of $20/month contributes $30 to MRR.
- Coupons and discounts are included in the MRR. If a customer purchases a subscription for $30/month using a $10 discount coupon, the MRR contribution from that subscription would be $20 while the coupon is valid, and $30 after it has expired.
The Subscription Lifecycle and MRR
MRR measures projected (monthly) revenue, so upgrades and downgrades are factored in the MRR starting from the day they occurred, not from the day they affect revenue (that is, the next billing cycle).
For example, given a single active subscription purchased on October 1st for $5/month, the next billing cycle for this subscription would be on November 1st. This subscription is then upgraded on October 10th, with its price going from $5/month to $20/month.
The new pricing would take effect starting from the new billing cycle (that is, the billing on November 1st would be $20 instead of $5), but the change would be reflected on MRR starting from the day the subscription was upgraded:
- MRR on October 1st (the day the subscription was activated) = $5
- MRR on October 10th (the day the subscription was upgraded) = $20
- MRR on November 1st (the first billing cycle affected by the upgrade) = $20
This scenario assumes that the subscription did not get other upgrades or downgrades before November 1st and that it was still active as of November 1st.
Downgrades follow the same logic. A downgrade starts affecting MRR from the day the downgrade occurred, and not from the day the downgrade starts affecting billing.
Pausing or resuming a subscription also follows the same methodology. Events affect the MRR starting from the day the subscription was paused or resumed.
Example
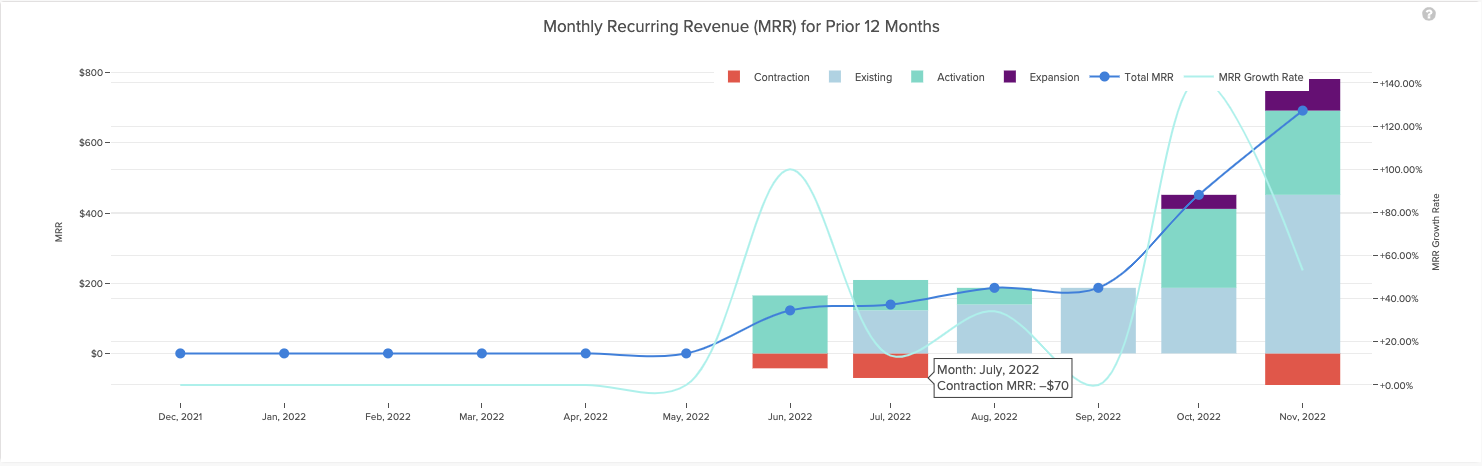
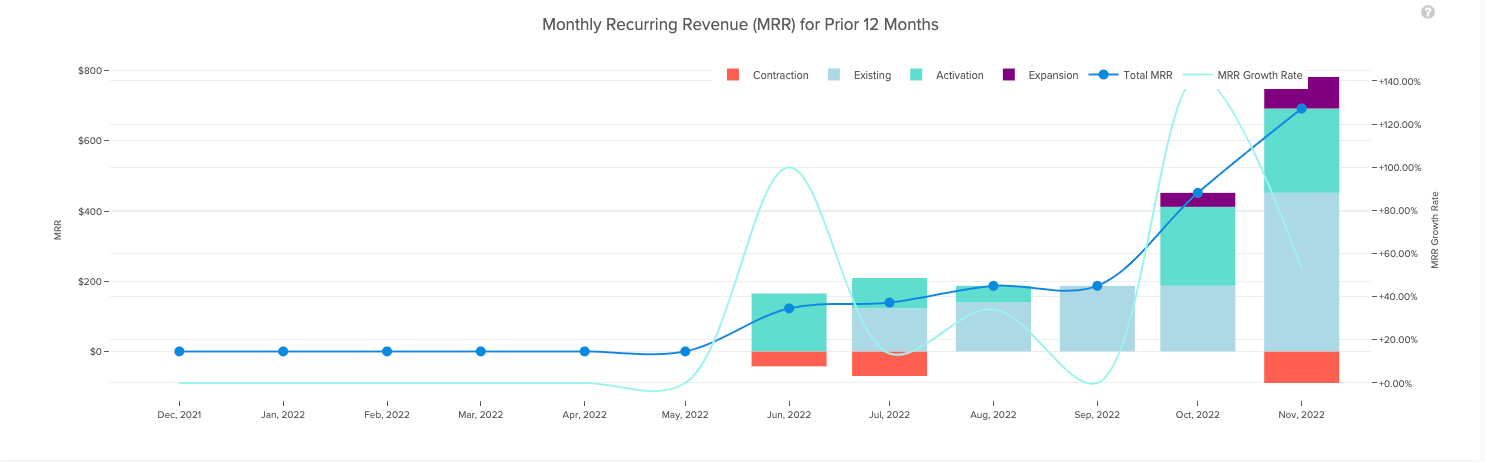
The example chart shows the following:
- The blue line shows MRR changes, with the dots on the blue line representing the value of the MRR on the last day of each month.
- For each month, the chart also shows the contributions (positive or negative) of subscription events to MRR (upgrades or downgrades). The sum of those contributions equals the value of the MRR on the last day of that month.
For example, the chart shows that in September 2022 there were no changes to subscriptions (that is, no new activations or deactivations and no upgrades or downgrades). The value of MRR on the last day of that month is the same as on the last day of the previous month (August 2022). The chart shows this contribution as Existing.
In October 2022, however, new subscriptions were activated (adding to the MRR), and some subscriptions were upgraded or resumed (adding even more to the MRR). The chart shows that the contributions to the value of the MRR for the last day of October can be broken down into three categories:
- Existing
- Activation (MRR from new subscriptions)
- Expansion (additional MRR from upgrades or resumed subscriptions)
There can also be negative contributions to MRR, generated by downgrades, deactivated subscriptions, or paused subscriptions. These negative contributions are categorized as Contraction in the chart.
Due to these negative contributions, the position of the blue dots in the chart (the value of MRR on the last day of each month) could be lower than the highest point of the stacked bar for that month, as is the case for June 2022, July 2022, and November 2022.
In other words, the value of MRR on the last day of the month (blue dot) is equal to that month’s positive contributions (Existing + Activation + Expansion), minus that month’s negative contributions (Contraction).
MRR Churn Rate
MRR Churn Rate indicates the percentage of MRR lost within a 30-day period.
Methodology
MRR Churn Rate is calculated daily. For a given date, the value of MRR Churn Rate is calculated with the following formula:
MRR Churn Rate (percentage) = 100 * -1 * (Total negative contributions to MRR over past 30 days, excluding the current date) / (Value of MRR 30 days ago)
Negative contributions to MRR are generated by events like downgrades, deactivations, or pausing subscriptions. See Monthly Recurring Revenue for more details.
Given that these contributions are negative, the -1 in the formula ensures that the MRR Churn Rate is a positive number.
For example, assume that you wanted to calculate the MRR Churn rate on July 21st, and that:
- Value of MRR on June 21st = $7500
- Total negative contribution to MRR between June 21st and July 20th = -$600
Then the value of MRR Churn Rate on July 21st would be 8%:
100 * -1 * (-$600) / $7500 = 8%
FastSpring’s MRR Churn Rate calculation also factors in the following:
- MRR Churn Rate is a percentage, either
0or a positive number. - FastSpring calculates MRR Churn Rate using a 30-day date range, excluding the current date.
Example
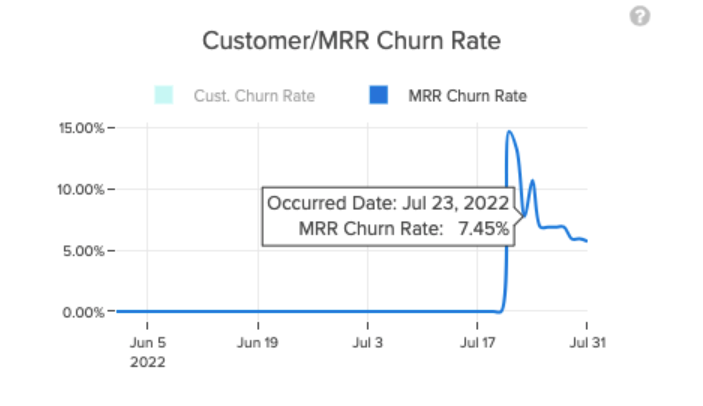
The example chart shows the following events:
- On July 23rd, the MRR Churn Rate was 7.45%, which means that over the last 30 days, the seller lost 7.45% of the MRR that they used to have 30 days ago.
- On July 3rd the MRR Churn Rate is 0%, which means that over the previous 30 days there was no reduction in MRR.
MRR Growth Rate
MRR Growth Rate represents the change of the MRR value over the previous 30 days.
Methodology
MRR Growth Rate is calculated daily. For a given date, the value of MRR Growth Rate is calculated with the following formula:
MRR Growth Rate = 100 * (Today’s MRR - MRR 30 days ago) / MRR 30 days ago
For example, assume that you wanted to calculate the MRR Growth Rate on October 31st, and that:
- Value of MRR on October 31st = $1500
- Value of MRR on October 1st = $1000
Then the value of MRR Growth Rate on October 31st would be 50%:
100 * ($1500 - $1000) / $1000 = 50%
FastSpring’s MRR Growth Rate calculation also factors in the following:
- MRR Growth Rate is a percentage that can be negative, positive, or
0. - FastSpring rounds MRR growth rate to two decimal places.
See Monthly Recurring Revenue for more details.
Example
The example chart shows the following:
- The green line in the chart shows Growth Rate changes. For each month, the green line shows the value of MRR Growth Rate on the last day of that month.
- The MRR Growth Rate on the last day of June is 100% (see the vertical axis on the right), meaning that MRR has doubled over the previous 30 days (here, in June).
- The MRR Growth Rate on the last day of September is 0%, which means that there were no changes to MRR in September.
New Customers
New Customers represents the number of unique, new subscribers that purchased at least one subscription on a specific date. The New Customers metric is not cumulative.
Methodology
- New customers is an integer: either
0or a positive number. - New Customers is calculated daily.
- FastSpring considers a user a new customer when they complete an order after checkout.
- If a customer purchases multiple subscriptions on a given date, FastSpring considers them as a single new customer for that date.
- FastSpring includes reactivated subscriptions in the New Customers metric.
Example
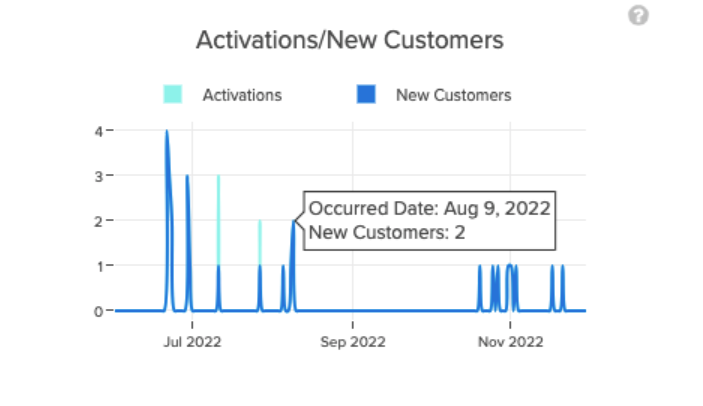
The example chart shows the following events:
- On July 11th, one customer purchased three subscriptions. The chart shows three activations (the green line) but only one new customer (the blue line).
- On August 9th, two customers purchased one subscription each, so the value of New Customers is
2. - On November 1st, a customer reactivated a subscription, so the value of New Customers is
1.
Subscription Churn
Subscription churn counts the number of subscriptions that were deactivated during a given time frame.
Methodology
- Subscription churn is an integer. Each integer is either
0or a positive number. - Subscribers with deactivated subscriptions can reactivate them within the reactivation period. FastSpring doesn’t include reactivated subscriptions in Subscription Churn.
Subscriber Loss
Subscriber loss counts the number of subscribers that deactivated all of their subscriptions during a given time frame.
Methodology
- Subscriber loss is an integer. Each integer is either
0or a positive number. - Subscribers with deactivated subscriptions can reactivate them within the reactivation period. FastSpring doesn’t include reactivated subscriptions in subscription churn.
- FastSpring only attributes subscriber loss to subscribers who have deactivated all their subscriptions. For example, if a subscriber has three subscriptions and only deactivates two, FastSpring doesn’t include that customer in the subscriber loss metric.
Updated 25 days ago